About Atrix
Lorem ipsum dolor amet consectetur adipisicing sed do eiusmod tempor incididunt labore magna aliqua enim minim veniam nostrud exercitation aboris nis aliquip exeo.
Find Us Our Location
- 629 12th St, Modesto, CA 95354 United States
- atrixmain@gmail.com
- +1 (230)-456-155-23
Blog Standard
-through-Advanced-Analysis3.jpeg)
Exploring the Thermal Properties and Crystallinity of Polylactic Acid (PLA) through Advanced Analysis
Polylactic acid is a biodegradable plastic synthesized from plant-based materials like corn or sugarcane, offering an environmentally friendly alternative to traditional petroleum-based plastics. Its crystallinity affects mechanical strength, impact resistance, transparency, and biodegradability, making it a key consideration in applications such as packaging, fibers, and medical implants. PLA’s monomer, lactic acid, contains optical isomers (levo-rotatory [L] and dextro-rotatory [D]), which, along with molecular weight, influence crystallinity and heat transfer resistance. Understanding these properties through thermal analysis is essential for tailoring PLA’s performance during polymer molding manufacturing.
Thermal Analysis Techniques: DSC and TG/DTA
The study employed Differential Scanning Calorimetry (DSC) and Thermogravimetric Analysis (TG/DTA) to investigate PLA’s thermal behavior. DSC measures heat flow to detect transitions like glass transition, cold crystallization, and melting, while TG/DTA evaluates heat transfer resistance and thermal decomposition. Four PLA samples (a, b, c, and c') were analyzed, with samples a, b, and c having similar molecular weights but varying L/D ratios (a < b < c), and sample c' having the same L/D ratio as c but a lower molecular weight. DSC samples were heated from 20°C to 200°C at 10°C/min in a nitrogen atmosphere, then cooled at rates ranging from 0.1°C/min to quench cooling. TG measurements heated 10 mg samples to 400°C at rates of 1, 2, 5, and 10°C/min.
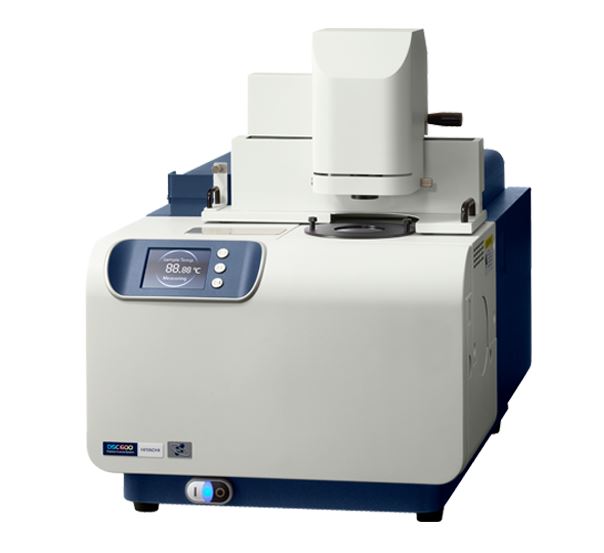
Hitachi NEXTA DSC200
Crystallinity and Cooling Rate Effects
Crystallinity in polylactic acid is heavily influenced by the cooling rate during processing. DSC results revealed:
- Glass Transition: All samples exhibited a glass transition temperature around 60°C, marking the shift from a glassy to a rubbery state.
- Melting Behavior: : Samples b, c, and c' showed endothermic melting peaks at 150°C (b) and 170°C (c and c') when cooled slowly at 0.1°C/min, indicating crystallization. Sample a, with the lowest L ratio, remained nearly amorphous, showing no melting peak even at slow cooling rates.
- Cooling Rate Impact: Sample b displayed a melting peak only at cooling rates of 1°C/min or slower, suggesting that slower cooling enhances crystallinity. Samples c and c' showed similar crystallinity at 0.1°C/min, but at faster rates (≥0.5°C/min), sample c' (lower molecular weight) exhibited higher heat of fusion, indicating greater crystallinity.
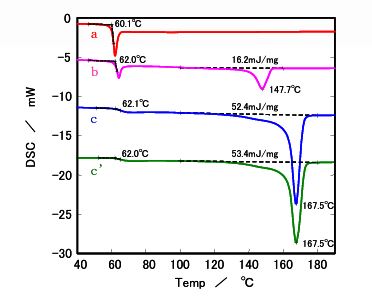
Figure 1. DSC results after cooling at 0.1 °C/min
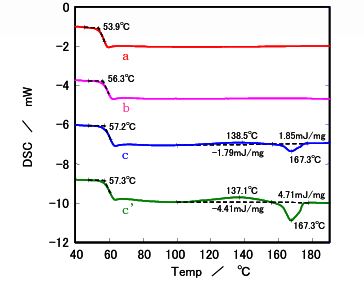
Figure 2. DSC results after quench cooling
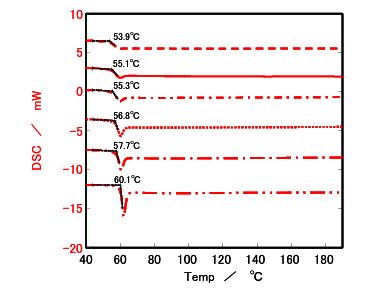
Figure 3. DSC results for Sample a
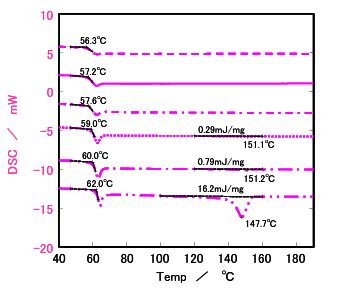
Figure 4. DSC results for Sample b
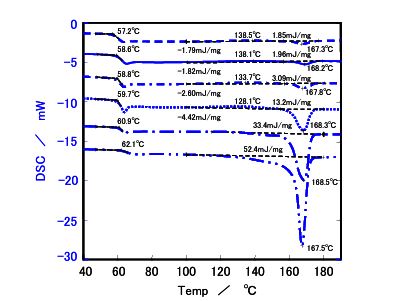
Figure 5. DSC results for Sample c
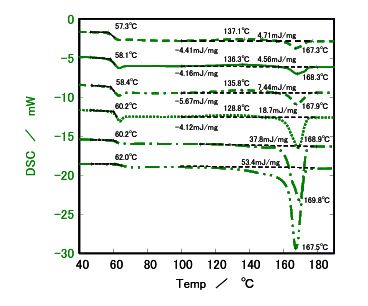
Figure 6. DSC results for Sample c′
▬ ▬ ▬ ▪ After quench cooling
───────── After cooling at 10 °C/min
─ ▬ ▬ ─ After cooling at 5 °C/min
░░░░░░░░ After cooling at 1 °C/min
─ ▬ ─ ▬ After cooling at 0.5 °C/min
─ ▬ ▬ ─ ▬ After cooling at 0.1 °C/min
The heat of fusion, a measure of the energy required to melt crystalline regions, was used to calculate relative crystallinity, with sample c' at 0.1°C/min set as the reference (value of 1). Higher L ratios correlated with increased crystallinity, while molecular weight influenced crystallinity at faster cooling rates, with lower molecular weight samples (c') showing higher crystallinity due to enhanced chain mobility.
Table 1. Comparison of relative crystallinity by cooling rate
°C/min
| Rate/Sample | 0.1 | 0.5 | 1 | 5 | 10 | Quench cooling |
|---|---|---|---|---|---|---|
| a | – | – | – | – | – | – |
| b | 0.303 | 0.015 | 0.005 | 0 | 0 | 0 |
| c | 0.981 | 0.625 | 0.164 | 0.009 | 0.003 | 0.001 |
| c' | 1 | 0.708 | 0.273 | 0.033 | 0.007 | 0.006 |
* The heat of fusion of Sample c′ after cooling at 0.1°C/min was set as 1.
Cold Crystallization and Molecular Weight
Cold crystallization temperature, observed around 140°C in quench-cooled samples, was more pronounced in sample c' compared to c, reflecting the impact of lower molecular weight on chain rearrangement. This indicates that molecular weight not only affects crystallinity but also the kinetics of crystallization during rapid cooling, critical for manufacturing processes like injection molding.
Heat Resistance and Activation Energy
TG/DTA analysis assessed PLA’s heat transfer resistance and thermal decomposition. No significant differences in thermal decomposition were observed between samples b and c, suggesting comparable stability at the tested heating rates (1–10°C/min). However, kinetic analysis using the Ozawa method revealed differences in activation energy for thermal degradation:
- Sample b (lower L ratio): 144 kJ/mol, with a degradation lifetime of 15.4 hours.
- Sample c: 155 kJ/mol, with a lifetime of 21.6 hours.
- Sample c' (lower molecular weight): 136 kJ/mol, with a lifetime of 10.9 hours.
These results indicate that samples with higher L ratios (c) have greater heat transfer resistance, while lower molecular weight (c') leads to faster degradation, as reflected in the Arrhenius plot for sample c. This underscores the interplay of optical isomers and molecular weight in determining PLA’s thermal stability.
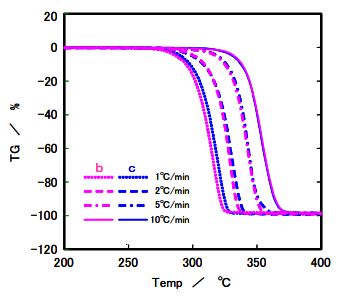
Figure 7. TG results for Sample b and c
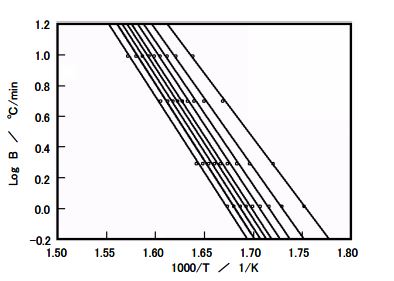
Figure 8. Arrhenius plot results for Sample c
Table 2. Calculation results for activation energy
| Sample | ΔE [kJ/mol] | Constant Temperature Degradation Time (Life Time) (hr.) |
|---|---|---|
| b | 144 | 15.4 |
| c | 155 | 21.6 |
| c′ | 136 | 10.9 |
* 230 °C, 10% reaction
Implications for PLA Applications
The findings highlight the importance of tailoring cooling rate and optical isomer ratios during polymer molding manufacturing to achieve desired crystallinity and heat transfer resistance. For applications requiring high strength and transparency (e.g., packaging), slow cooling and higher L ratios enhance crystallinity. Conversely, amorphous PLA (like sample a) may suit applications prioritizing flexibility or biodegradability. The thermal analysis of polylactic acid provides actionable insights for optimizing processing conditions, ensuring renewable polymer materials like PLA meet performance requirements in diverse applications.
Conclusion
Polylactic acid stands out as a versatile biodegradable plastic, with its crystallinity and heat transfer resistance shaped by optical isomers, molecular weight, and cooling rate. Differential Scanning Calorimetry and Thermogravimetric Analysis reveal how these factors influence glass transition, cold crystallization temperature, heat of fusion, and activation energy, guiding the design of PLA-based products. By leveraging TG/DTA analysis and the Ozawa method, manufacturers can fine-tune PLA’s properties, advancing the adoption of renewable polymer materials in sustainable technologies.
Inkarp Instruments is a trusted distributor and service provider of Hitachi products in India, providing cutting-edge solutions crafted to address the dynamic requirements of modern research. With a firm commitment to quality and integrity, we enable researchers nationwide with innovative tools and expert support to advance discovery and innovation.
References: Hitachi